

PLC Troubleshooting: Plant Is Down — What to Check First
From the alarm view to the block: the sequence that holds up under pressure, the TIA Portal tools that pay off, and five recurring fault classes.
Key Takeaways
Working structurally means you don't search for faults – you narrow them down. This guide covers the sequence that holds up under pressure, the TIA Portal tools, and the fault classes that account for most cases.
- The sequence that holds up – from symptom to cause
- The tools – on the panel and in TIA Portal
- Five fault classes – that cover most of it
1.Why trial and error is the most expensive route
A plant is down. Production is waiting, the phone is ringing, and TIA Portal is showing you a program that was running yesterday. The reflex in that situation is almost always the same: look somewhere you suspect the fault.
That is precisely the most expensive route. Not because guesses are inherently wrong – but because a refuted guess leaves nothing behind. You know no more than before and have lost twenty minutes. After the fifth guess an hour is gone and the pressure has risen.
Systematic narrowing works the other way round: every step halves the search space, regardless of whether the assumption held. A negative result is still a result.
2.The sequence that holds up under pressure
Every efficient troubleshooting session follows the same chain:
Symptom → alarm on the HMI → affected block → signal path → cause
The first look does not belong in TIA Portal but on the operator panel.
2.1.Step 1: The alarm view, not the code
When a plant stops, it usually has something to say about it. The alarm view on the operator panel – on a WinCC Unified Panel just as on a Comfort Panel – shows which alarm is standing, since when, and in which order the alarms arrived. Nothing narrows the search space faster: the alarm names the unit and the function, and in a well-maintained alarm concept it says in plain words which release is missing.
What matters is the order of the alarms, not the top line. The alarm that came first is usually the cause, everything after it a consequential alarm – an emergency stop drags a whole chain behind it, and whoever investigates the last alarm first is working on the symptom.
The second look goes into the alarm archive. It shows not only which fault occurred but how often and at what time – and with that, the answer to the question that decides how you proceed: one-off or permanent state? Ten identical alarms in one morning, each acknowledged and driven on, describe a different problem than a fault occurring for the first time, even when the alarm text is identical.
And if nothing is standing? That is a finding in itself. Either there is no alarm for this case – then it is missing from the alarm concept and belongs on the follow-up list – or the plant is not stopped by a fault at all but by an interlock working exactly as intended: a missing release, the wrong operating mode, an open safety door contact.
2.2.Step 2: If no alarm is standing – diagnostic buffer and LEDs
Only now does the CPU diagnostic buffer become interesting, and then very quickly: it logs module failures, peripheral errors, STOP causes and cycle time errors with timestamps. If it shows a module failure, every further minute in the program code is lost.
For one class of faults it is even the tool of first choice: communication problems. A dropped PROFINET device, an intermittent contact in the cable, a device that comes and goes cyclically – such events land in the diagnostic buffer with a timestamp, while in the program all you see is values freezing. The same rule of thumb applies to hardware. Conversely: a pure logic problem is not found there – for that, the alarm on the HMI is the entry point.
The same goes for the LEDs on the CPU and peripherals. A red SF LED on an ET 200 ends the discussion about program logic in two seconds.
The classic time sink
A faulty sensor, a loose terminal or a failed module produce exactly the same symptom in the program as a logic error: a condition never becomes true. Anyone who does not make this distinction early may spend hours looking for a fault that is not in the program.
2.3.Step 3: From the alarm to the responsible block
The alarm is the entry point into the code: where is this alarm bit set? A cross-reference on the alarm tag leads straight into the block that generates the fault – provided the program is cleanly structured and alarms are raised at a defined place per plant section.
State the symptom as concretely as possible alongside: not "the plant isn't working" but "conveyor 3 does not start after the start command, fault message 'drive feedback missing' after 5 seconds". From that phrasing the block follows almost by itself. If everything is wired into OB1, this is where the laborious part begins.
2.4.Step 4: Trace the signal path backwards
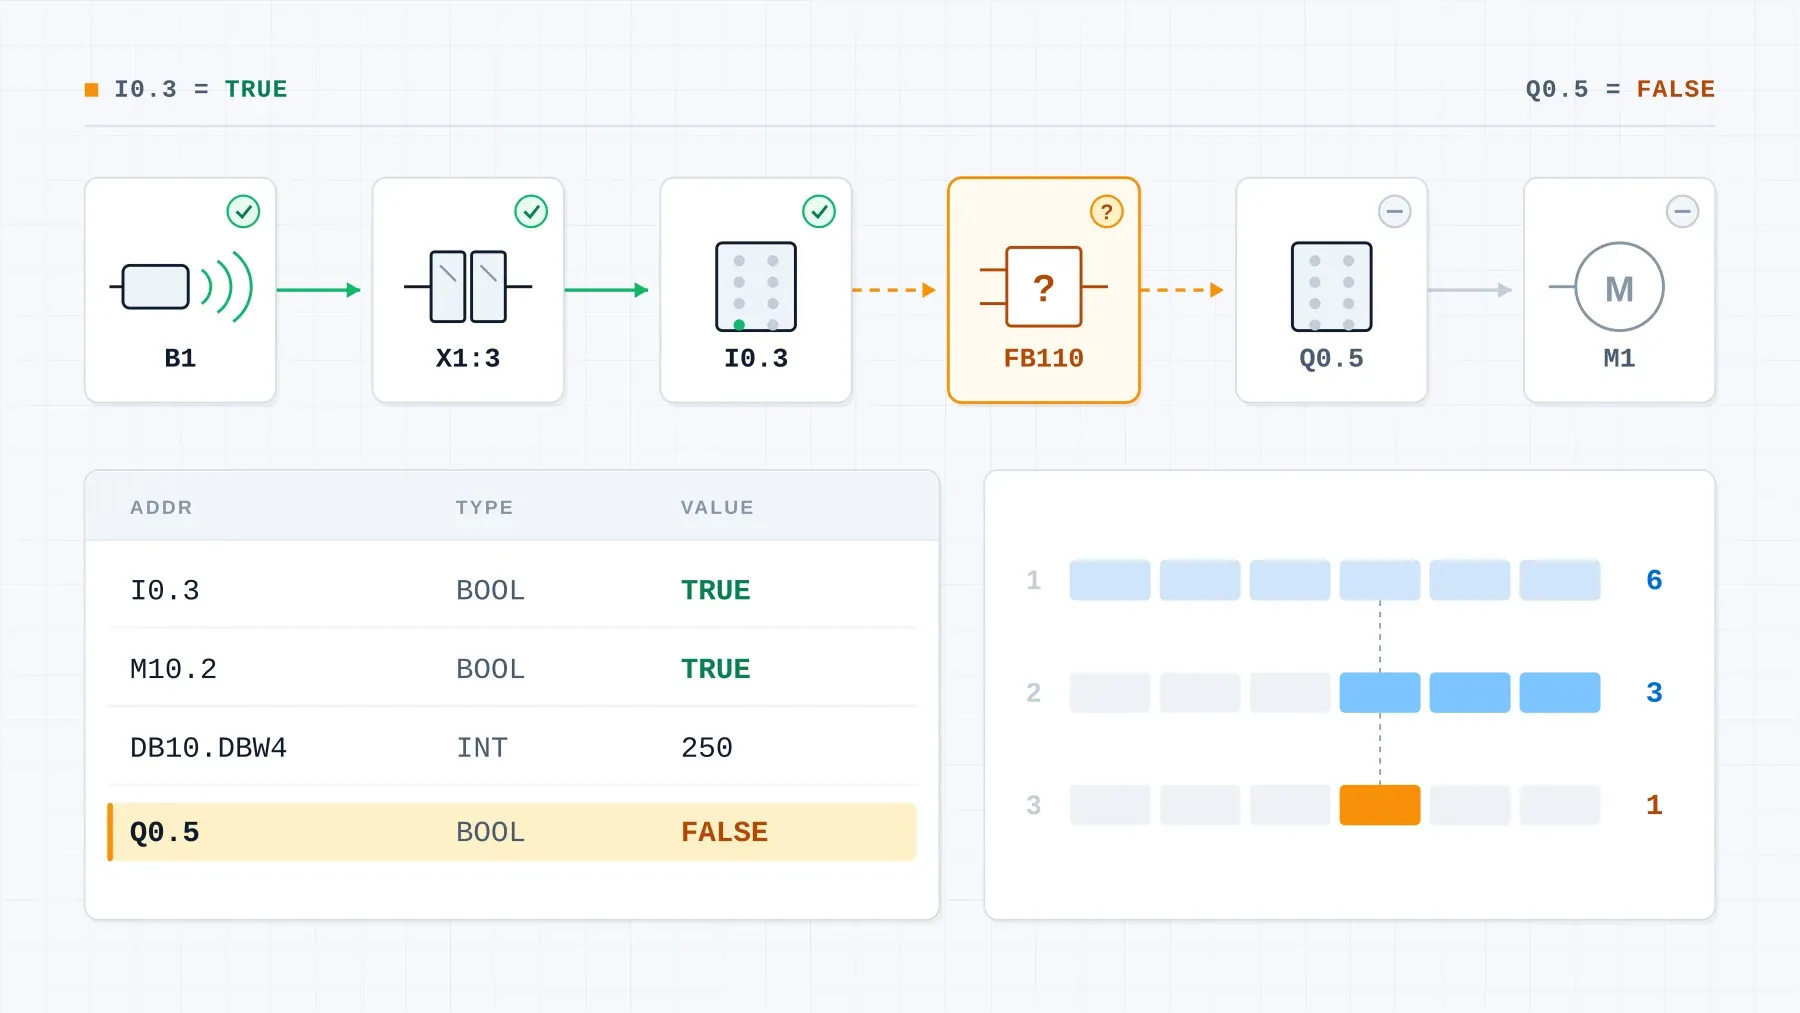
Take the output that is not switching and work back to its conditions. Which interlock prevents it from being set? Which of those partial conditions is false? And why?
This backwards walk is the core of the method. It always ends at one of three points: an input condition that never arrives (hardware or upstream logic), an interlock that is engaging (usually intentionally), or an assignment being overwritten from elsewhere.
2.5.Step 5: What is too fast for the watch table – trace
Some effects cannot be caught within the cycle: a signal that is present for 20 milliseconds, an edge that falls at the wrong moment, a timer that only sporadically fails to elapse. That is what the trace function is for. It records selected tags synchronously with the cycle and shows the curve instead of the momentary value.
The decisive move: put the trigger on the alarm itself. The recording then runs exactly at the moment the alarm arrives, and you see the milliseconds before it – instead of waiting for the fault to happen while you watch. Record everything involved in the alarm: the triggering sensors, the interlocks, the timers.
From a service case
A plant kept stopping; the team kept production running by acknowledging – ten times in one morning, the same fault message – and then called for support. How often and at what times the alarm had come was in the alarm archive. The cross-reference on the alarm bit led into the network where the alarm is generated; two photoelectric sensors were the suspects. With a trace triggered on exactly that alarm, the curve was unambiguous: one of the two sensors was flickering. In cases like this the alarm condition is worth a second look: an alarm that already responds to that kind of bouncing produces precisely this picture of constant acknowledgement without anyone seeing the cause. Sensor and alarm logic are better looked at together.
3.The tools: on the panel and in TIA Portal
| Tool | What it is good for | Typical use |
|---|---|---|
| Alarm view on the HMI | Which alarm is standing, since when, in which order? | The first look. The first alarm is usually the cause, the rest consequential |
| Watch table | Read live values without disturbing the process | The standard tool in the code. Collect the suspect block's signals and observe them running |
| Cross-references | Where is a tag written, where read? | From the alarm bit into the generating block; first remedy against double assignments |
| Trace | Record signal curves synchronously with the cycle, with trigger | For everything too fast or too rare for the watch table |
| Call structure | Is the block being called cyclically at all? | When a block "does nothing" although the logic is correct |
| Diagnostic buffer | Hardware events with timestamps | When no alarm is standing on the HMI, or when it smells of a module |
| Online/offline comparison | Does the CPU deviate from the documented state? | Uncovers undocumented changes "from last night shift" |
| PLCSIM | Reproduce logic without the plant | For reproducible faults and safely playing through variants |
3.1.Forcing: the tool you almost never need
Forcing overwrites physical inputs and outputs and stays active until explicitly cleared – across a CPU restart too. On a running plant with moving axes that is a safety risk, not a diagnostic tool.
For pure observation the watch table is enough. If you genuinely have to set a value, do it deliberately, documented, and with a colleague watching the plant – and clear it before you leave. A forgotten force is a time bomb that goes off at the next startup, when nobody remembers it was set.
4.Five fault classes that account for most cases
4.1.1. Double assignments
The same tag is written in two blocks. In the cyclic sequence the last processed assignment "wins" – the output flickers or stubbornly stays at one value although the visible logic says otherwise.
Detection: cross-references. Any tag with more than one writing location is suspect.
4.2.2. Edge detection faults
An action fires continuously instead of once, or not at all. The cause is usually a missing rising edge (R_TRIG) or an edge memory bit used in several places – the first evaluation consumes the edge and the second never sees one.
Detection: watch table on the edge memory bit plus cross-references to it.
4.3.3. Timing and cycle problems
A timer whose start condition is reset within the same cycle never expires. Conversely, excessive cycle times trigger the cycle time error OB (OB80) – visible in the diagnostic buffer.
Detection: check cycle time in the CPU diagnostics, observe the timer input in the watch table.
4.4.4. Data block mix-ups
With multiply instantiated function blocks, the wrong instance DB is passed. The logic is correct, but drive 2 reacts to drive 1's values.
Detection: look at the call structure – which block receives which DB?
4.5.5. Hardware disguised as software
A wobbling proximity switch, a cable break in the drag chain area, a module with sporadic dropout. The symptom is visible in the program, the cause is not.
Detection: sporadic behaviour is the warning sign. A fault that cannot be reproduced rarely lies in the logic – logic is deterministic.
Rule of thumb
Reproducible faults are usually software. Sporadic faults are usually hardware or timing. This single distinction saves more time than any individual tool.
5.When the plant is down: the sequence under pressure
When production is waiting, a fixed sequence helps more than intuition:
- Read the alarm view. Which alarm is standing, since when, and which one came first?
- If no alarm is standing: diagnostic buffer and LEDs. Settles in seconds whether the software is involved at all.
- State the symptom precisely. What exactly does not happen, since when, under which conditions?
- Ask about the last change. "It ran yesterday" is the single most valuable piece of information – the online/offline comparison shows whether anyone touched anything.
- Work back from the alarm bit via cross-references into the block, then build a watch table for the suspect area – instead of clicking through networks.
- Record a trace if the effect is too fast or too rare for the watch table.
- Document the finding before releasing the plant again – otherwise the whole search repeats next time.
Point 7 is almost always dropped under pressure and is the only one that prevents the same search starting from scratch in three months.
6.Clean code is diagnostic infrastructure
Most of the points above presuppose something: a clear block structure, meaningful names, a commented symbol table. That is not an end in itself and not a question of aesthetics.
A program in which every plant section is encapsulated and named turns hours of guesswork into minutes of targeted narrowing. A commented block tells you at a glance what it is supposed to do – and therefore where it deviates. A block full of M0.0 and DB1.DBX0.0 tells you nothing, and troubleshooting starts from zero.
When the legacy program is the actual cause
On plants running an S5 or S7-300, the offline project is often missing: what remains is an upload from the CPU without symbols and without comments, and every fault starts from zero again. A control system retrofit then does more than solve the spare parts problem – it replaces that program base with a structured, documented one: control system retrofit to S7-1500 and S7-1200.
7.Conclusion
Troubleshooting is method, not talent. Three things carry most of it:
- The alarm view first – the plant usually says itself what it is missing; the first alarm is the cause, everything after it a consequence.
- No alarm is a finding too – then the diagnostic buffer and the LEDs settle in seconds whether the software is involved at all; and afterwards the question stands why there is no alarm for this case.
- Work backwards from the symptom rather than forwards from a guess – every step shrinks the search space, even when the assumption was wrong.
- Reproducible or sporadic? – this distinction separates software from hardware and timing problems before you open the first network.
- Tool by fault class – logic problems via the alarms on the HMI, communication and hardware faults via the diagnostic buffer, sporadic effects via a trace triggered on the alarm.
Support during a fault
When a plant is down and the cause cannot be narrowed down – or when the program is so unstructured that every search starts from scratch: I support fault analysis, re-documentation and structural rebuilds. From Luxembourg, regularly on site in Saarland and the Trier region. Let's talk.
8.Further reading
- PLC Programming: 8 Best Practices for Clean, Maintainable Code – the structure that makes troubleshooting efficient in the first place
- PLC Documentation: What Belongs In It and What Matters at Handover – why the alarm list decides during a fault
- The 5 PLC Programming Languages of IEC 61131-3 – which language is how easy to debug
Questions about your automation project?
As an automation engineer based in Stadtbredimus, Luxembourg, I offer free initial consultations for companies in the Greater Region Saar-Lor-Lux.
David Prybisch · PLC · HMI · Commissioning
Related Articles

PLC Programming: 8 Best Practices for Maintainable Code
Write clean, maintainable PLC code in Siemens TIA Portal: proven naming conventions, FB/FC structure, NAMUR alarm handling, Git and simulation testing.
Read more: PLC Programming: 8 Best Practices for Maintainable Code
PLC Documentation: 3 Layers and a Handover Checklist
What belongs in PLC documentation: three layers from code to plant file, a checklist for the handover and how to proceed with only an online upload.
Read more: PLC Documentation: 3 Layers and a Handover Checklist
The 5 PLC Programming Languages: LD, FBD, IL, ST, SFC
Which language for which task: LD, FBD, IL, ST and SFC under IEC 61131-3, how the Siemens names map onto them and a decision guide for TIA Portal.
Read more: The 5 PLC Programming Languages: LD, FBD, IL, ST, SFC